|
Online Market Indicators
Using the Bullish-Bearish Indicator to Spot a Potential
Market Bottom or Top
There are several Online Market Indicators
investors can
use to help them determine when a Market Bottom or Top is nearing. One of
the more important ones is the Bullish-Bearish Indicator which shows the % of
Bullish and Bearish Investment Advisors. Online Market Indicators are available from
Amateur-Investor.net, Investors Intelligence and is also published by Investors Business Daily as well.
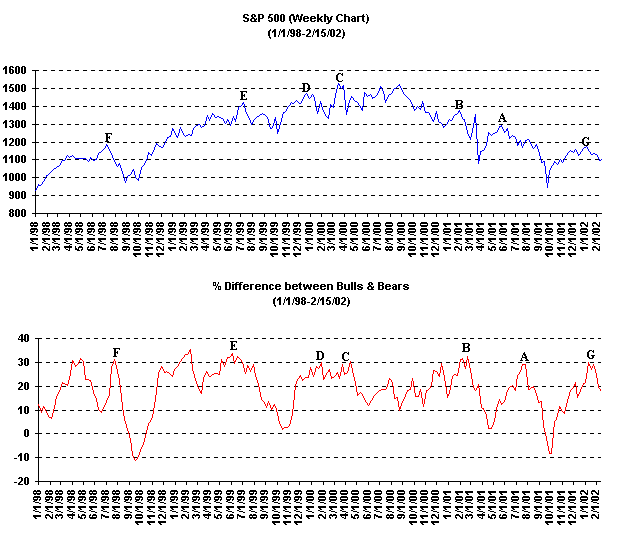
Generally when there is a large difference ( >30%) between
the % of Bullish and Bearish Investment Advisors there is an excessive amount of
Bullishness in the market which usually is indicative of a nearing top.
The chart below compares the S&P 500 versus the % difference between the
Bullish and Bearish Investment Advisors since 1998. As you can see when
the % difference between the Bullish and Bearish Investment Advisors is >30%
the S&P 500 has generally made a top and then reversed strongly to the
downside which has been useful online market indicator
for investors. Some examples include last Summer (point A), the early
part of 2001 (point B), the Spring of 2000 (point C), the early part of 2000
(point D), the Summer of 1999 (point E) and even further back in the
Summer of 1998 (point F). Recently the % difference between the % of
Bullish and Bearish Advisors reached near 30% again in January (point G) which
was a warning sign that the S&P 500 was likely nearing a top after rallying
strongly for three months.
Meanwhile on the flip side when the % difference between the
Bullish and Bearish Investment Advisors narrows and approaches a very low value
( <= 0%) then there is an excess of Bearishness which is a good online market
indicator that the market is likely nearing a bottom and will begin to reverse
strongly to the upside. Once again using the chart of the S&P
500 versus the % difference between the Bullish and Bearish Investment Advisors
below shows there have been four cases of this over the past four
years. They include last Fall (point H), last Spring (point I), in the
Fall of 1999 (point J) and further back in the Fall of 1998 (point K).
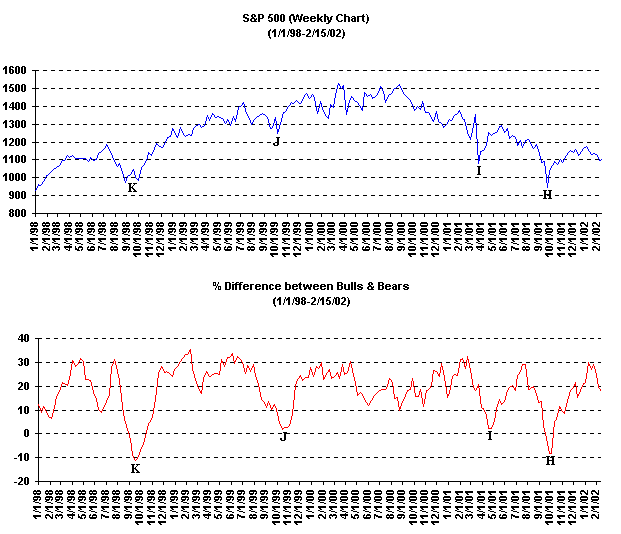
Thus as you can see the Bullish-Bearish Sentiment is one of the
better online market indicators out there and can be useful to investors.
Click Here for a
"Free" 2 Week Trial Membership and have access to our "Stocks to
Watch" List
Other
Helpful Investing Articles
| 
