
Stock Market Analysis for the Dow, Nasdaq and S&P 500
(8/23/03)
Friday is not the type of day you like to see to end a week as all three major averages gapped up at the open and then reversed strongly to the downside in the afternoon. This type of action suggests at least in the near term that a potential top is in place.
As mentioned in the Mid Week Market Analysis there were a couple of things to watch. First I said the Dow had to clear the 9500 level as this was a possible resistance area based on the longer term 50% Retracement Level calculated from the early 2000 high to the October 2002 low. This is exactly where the Dow ran into resistance at on Friday before reversing to the downside.
If the Dow remains under some selling pressure look for initial support at its 20 Day EMA (blue line) near 9275 or at its 50 Day EMA (green line) near 9150.
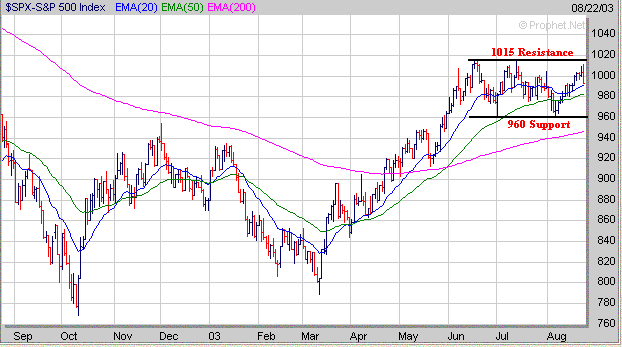
The second thing I mentioned to watch to see was if the S&P 500 could break out of its trading range and rise above the 1015 level to confirm the breakouts in the other two major averages. On Friday the S&P 500 stalled out just below the 1015 level and closed poorly. If the S&P 500 remains under some selling pressure the first area of support would be at its 50 Day EMA (green line) near 980. If the S&P 500 drops below 980 then the next major support area would be at the bottom of its trading range near 960.
.
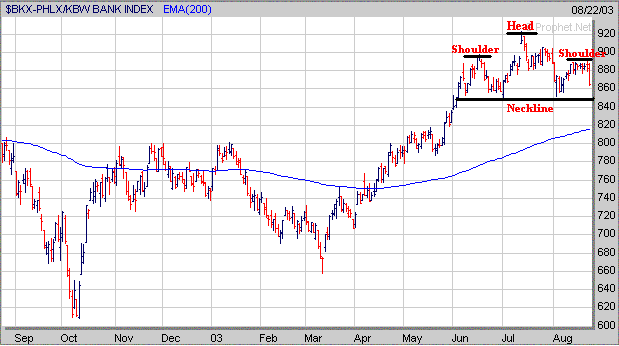
An additional sector to watch which could have implications on the S&P 500 is the Banking Index (BKX) which is heavily weighted in the S&P 500. As mentioned in the Mid Week Analysis the BKX was exhibiting a potential Head and Shoulders Top pattern and appears to be breaking down. The key support area for the BKX is around the 850 level which is at the Neckline in association with the Head and Shoulders Top pattern. If the BKX fails to hold support near 850 then it could drop back to its 200 Day EMA (blue line) which is approaching the 820 level.
Meanwhile the Nasdaq which gapped up strongly at the open on Friday closed poorly by the end of the day as well. If the Nasdaq remains under some selling pressure the first support level to watch is at its 20 Day EMA (blue line) near 1720. If it fails to hold support at its 20 Day EMA then the next area of support resides at its 50 Day EMA (green line) near 1680.
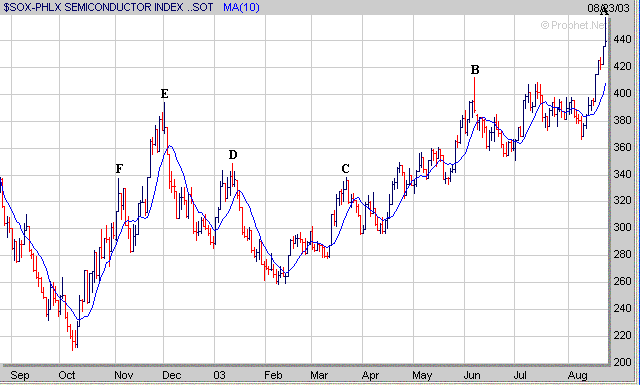
One reason the Nasdaq probably ran into trouble on Friday was due to the Semiconductor Index (SOX) becoming stretched significantly away from its 10 Day Moving Average (MA) as shown below (point A). Over the past year when the SOX has made a nice run and gotten a significant distance away from its 10 Day MA (points B, C, D, E and F) this has led to some type of pullback/correction.
It appears that one of two things may transpire in the SOX as it either will go through a minor pullback and then resume its upward trend such as occurred from June into early August and from mid March until mid April or it will go through a deeper pullback such as occurred from December of 2002 through mid February.
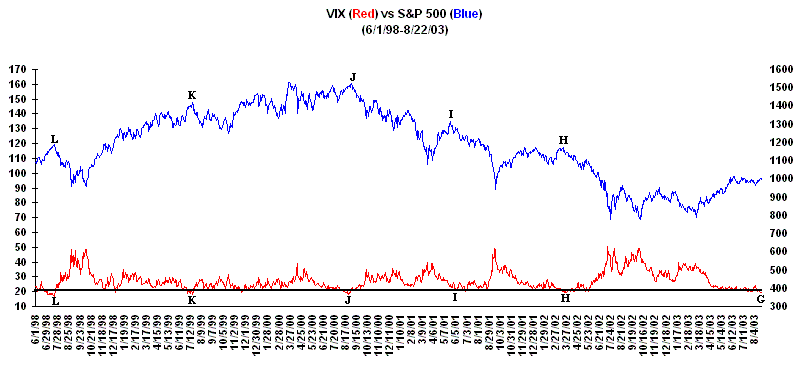
The Contrarian Indicators still show an excessive amount of Bullishness and Complacency remain in the market. The % difference between the Bullish and Bearish Investment Advisors remains quite high although it's not quite as high as it was in June.
Meanwhile the (Volatility Index) VIX remained below 20 much of this past week (point G) before rising above 20 on Friday. I'm sure by now you are getting tired of hearing this but at least since the late 1990's extremely low readings in the VIX have usually signaled nearing tops followed by some type of sell off (points H, I, J, K and L).
Meanwhile as I showed last weekend the Dow has been down nearly 70% of the time since 1900 during the month of September which has historically been the worst performing month by a long shot.
| Monthly Performance of Dow from 1900-2002 | |||||
| Month | % of (+) | % of (-) | Average Return | Average Loss | Average Return |
| Months | Months | (+) Months | (-) Months | (1900-2002) | |
| January | 63% | 37% | 3.66% | -3.58% | 1.02% |
| February | 49% | 51% | 3.06% | -2.94% | 0.30% |
| March | 59% | 41% | 3.59% | -3.72% | 0.57% |
| April | 57% | 43% | 4.58% | -3.50% | 1.08% |
| May | 54% | 46% | 3.43% | -4.18% | -0.08% |
| June | 48% | 52% | 4.25% | -3.20% | 0.34% |
| July | 61% | 39% | 4.50% | -3.53% | 1.42% |
| August | 65% | 35% | 3.86% | -4.47% | 0.99% |
| September | 31% | 69% | 3.49% | -4.69% | -1.31% |
| October | 59% | 41% | 3.60% | -4.54% | 0.32% |
| November | 59% | 41% | 4.69% | -5.28% | 0.63% |
| December | 70% | 30% | 3.13% | -3.07% | 1.27% |
| Average Yearly Return (1900-2002) | 6.55% | ||||
Thus the question is will a prolonged pullback/correction occur during the latter half of August extending into the month of September?
Finally a lot of you have asked me how do you know how far a stock will rise when it breaks out of a favorable chart pattern? That is never an easy question to answer however by recognizing longer term Resistance Areas and Retracement Levels can sometimes give you an idea of where a stock may rise to under favorable market conditions.
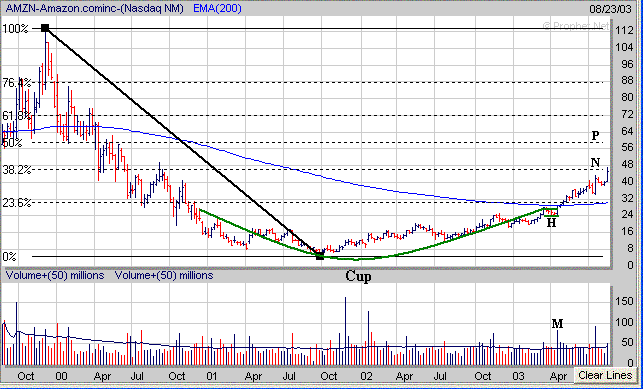
Here is an example. Notice how AMZN developed a "Cup and Handle (H)" pattern before breaking out on strong volume in April (point M). In this example the 23.6% Retracement Level (calculated from the 1999 high to the October 2002) was near $31 which also coincided with AMZN's 200 Weekly EMA (blue line). Once AMZN cleared the $31 level its next major area of upside resistance was at the 38.2% Retracement Level near $47 (point N) which is where AMZN rose to last week. In the longer term if AMZN can break solidly above the $47 level then it would have a chance to rally up to its longer term 50% Retracement Level near $59 (point P).
In addition to Retracement Levels you can also look at longer term Weekly Moving Averages and Valuation Prices based on projected future Earnings Growth to get an idea of how high a stock may rise once it breaks out of a favorable chart pattern as well.
In addition each Stock in our List includes
specific Pivot Points (Buy Prices), Stop Loss Prices and
potential Target Prices
| ||||||