|
Weekend Stock Market Analysis
(2/11/06)
It was a choppy week for the market with the Nasdaq and S&P
500 ending basically flat while the Dow was up just over 1%. A 10 minute
chart of the Nasdaq over the past several days shows there has been an increase
in volatility as there have been significant moves in both directions.
This type of action makes it a difficult environment for most investors to trade
in. 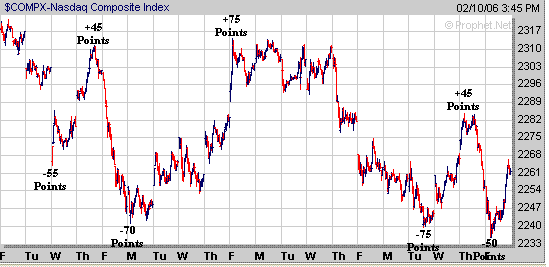
Meanwhile for those that have been
watching the Gold sector the Gold and Silver Index (XAU) has now encountered
strong resistance at its previous high near 155 which occurred in 1996 and
further back in 1987. As you can see the previous two times the XAU
stalled out near 155 this was followed by a strong sell off (points A to
B). It will be interesting to see if the current XAU suffers a
similar fate in the months ahead and what affect this could have on the
market. To see what occurred in the past when the XAU sold off you can
read the Mid Week Analysis I wrote on January 11th at http://www.amateur-investors.com/Mid_Week_Market_Analysis_1_11_06.htm 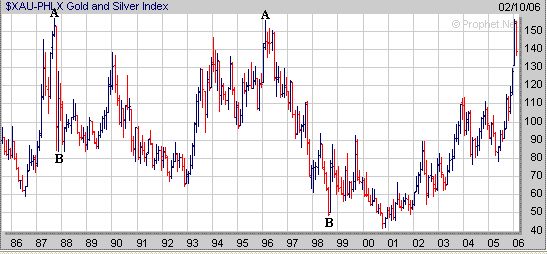
As far as the major averages despite
the Dow rallying the last three days of the week it still is exhibiting a
potential Head and Shoulders Top pattern. The key thing to watch next week
is if the Dow can break above its 2nd Shoulder near 10960 or not. If the
Dow is able to rise above its 2nd Shoulder then that would lead to a move back
to its high made in early January near 11050 and negate the Head and Shoulders
Top pattern. Meanwhile if the Dow isn't
able to rise above its 2nd Shoulder look for initial support at its 50 Day EMA
(blue line) near 10815. If the Dow were to break below its 50 Day EMA then
its next area of support would be near the 10640 level which is at the Neckline
associated with its Head and Shoulders pattern and is also near its rising 200
Day EMA (green line). 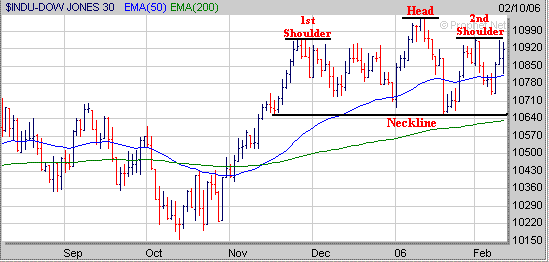
The S&P 500 has been
in a choppy pattern near its 50 Day EMA (blue line) during the past five trading
days. If the S&P 500 can rise above the 1275 level then it may rally
back to where it stalled out in late January just above the 1285 area (point
C). Meanwhile if the S&P 500 breaks below the 1255 level then look for
a drop back to the low made in early January near 1245 (point D) or its 200 Day
EMA (green line) around 1230. 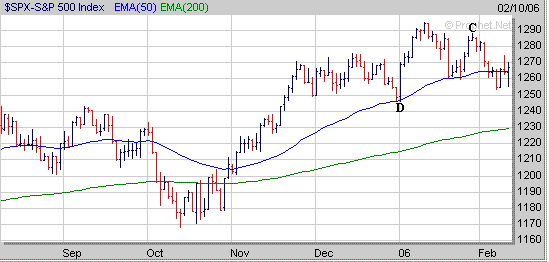
As for the Nasdaq it also has been
in a choppy mode near its 50 Day EMA (blue line) the past five trading days as
well. If the
Nasdaq can rise above the 2280 area then this could lead to a rally back to
where it stalled out at in late January near 2310 (point E). Meanwhile if
the Nasdaq drops below the 2235 level then look for its next area of support at
its low made in early January near 2190 (point F). 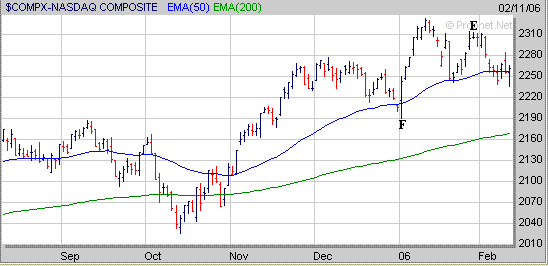
As I talked about last weekend one
sector that could have a big impact on the Nasdaq is the Semiconductors.
The Semiconductor Index (SOX) appears to have formed a
2 year Cup and is now beginning to develop a small Handle (H). If the SOX can
continue to hold support above the 510 level while developing its Handle this
could eventually lead to a strong move upward in the SOX at some point in the
future which would have a positive affect on the Nasdaq. 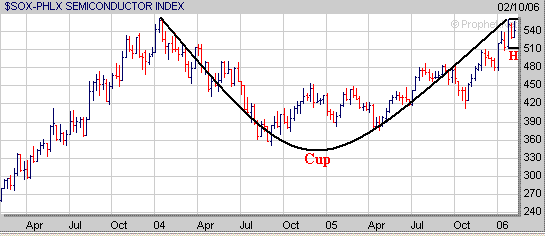
Meanwhile
a longer term chart of the SOX shows that if it does eventually move higher it
could rise up to the 640 level which is at its 38.2% Retracement Level and also
corresponds to the level it stalled out at in the early part of 2002 (point F). 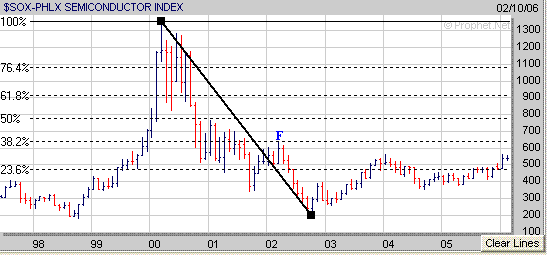
Over
the past few weeks some of the best looking chart patterns have started to show
up in the Semiconductor stocks. For example ISIL and UTEK from our current
Top 100 Stocks to Watch List have
formed the right side of a Cup. 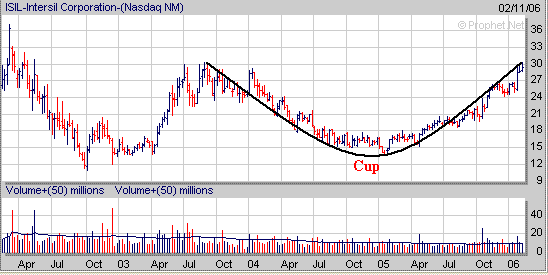
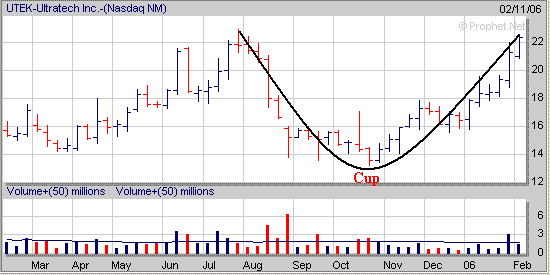
Keep
in mind just like the SOX both of these stocks now need to starting developing a
Handle over the next few weeks to complete a "Cup and Handle" pattern. In 2005 our Long Term Investing Strategy finished up 31% while
our Short Term Investing Strategy ended up 64%.
Signup today for a "Free"
2 Week Trial Membership to Amateur-Investors.Com and have access to
our current Stocks to Watch Buy List which contains stocks that are currently developing a favorable chart
pattern such as the Cup and Handle, Double Bottom and Flat Base which can be used with either our Long Term
Investing Strategy or Short Term Investing
Strategy.
Also you will have access to these other investment products.
Daily Breakout Reports
Market Timing Indicator
Weekly ETF Buy and Short Signals
Click
Here to Signup for a "Free" 2 Week Trial Membership
Send this Free Newsletter to a Friend or Relative
Amateur-Investors.Com
|


