|
Click
Here to save 50% on Premium Membership to amateur-investor.net
and have access to our Stocks to Watch List and Daily Breakout Reports
(We have extended our 50% Off Special for New Members
through July 4th)
Weekend Stock Market Analysis
(7/2/05)
The major averages pretty much traded sideways this past week
after coming under selling pressure the previous week. The price of Crude
Oil ran into resistance near its previous early April high near $60 and pulled
back some this week which may have helped the major averages stabilize
somewhat. The price of Crude Oil did hold support at its 10 Weekly EMA
(blue line) near $56 so that will be a key support level to watch over the next
few weeks. If the price of Crude Oil holds support near its 10 Weekly EMA
and then rallies above the $60 level this could eventually lead to a rise up to
around the $70 level at some point which would likely have a negative affect on
the major averages in the longer term. Meanwhile if the price of Crude Oil
fails to hold support at its 10 Weekly EMA then its next support area would be
at its rising 40 Weekly EMA (green line) near $50. If this occurs then
this could have a positive affect on the major averages in the longer
term. 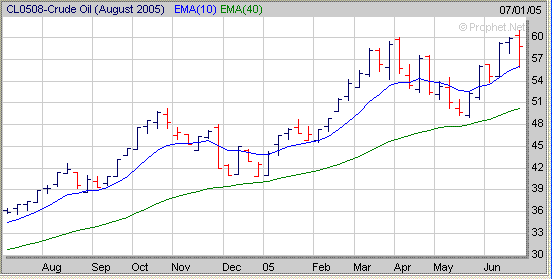
As
far as the major averages the Dow in the near term has held support at its
upward sloping trend line (brown line) originating from the April low but
encountered resistance this week just above 10400 which is where its 10 Weekly
EMA (blue line) and 40 Weekly EMA (green line) are near. Meanwhile the Dow
is still exhibiting a potential bearish looking Head and Shoulders Top pattern
from a longer term perspective. I see two possible scenario's occurring in
the weeks ahead. If the Dow can break solidly above the 10400 level then
it may rally back to its 2nd Shoulder near 10650. On the other hand if the
Dow drops below its upward sloping trend line near 10250 then I would expect it
to retest its April low near 10000 (point A). 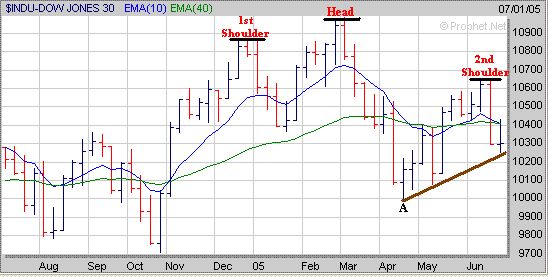
The Nasdaq held support this week at
its 10 Weekly EMA (blue line) near 2040 however it still has a major upside
resistance area near 2100 which has been the case since last February. If
the Nasdaq can hold support at or above its 10 Weekly EMA in the weeks ahead and
eventually break through the 2100 resistance area then it could eventually rally
up to its previous early January high near 2190 at some point. Meanwhile
if the Nasdaq comes under more selling pressure and drops below the 2040 level
then its next area of support would be near 2020 which is where its 40 Weekly
EMA (green line) and 38.2% Retracement Level (calculated from the August 2004
low to the early January high) come into play at. If the Nasdaq failed to
hold support near 2020 then its next potential area of downside support would be
near 1970 which is at its 50% Retracement Level (point B). 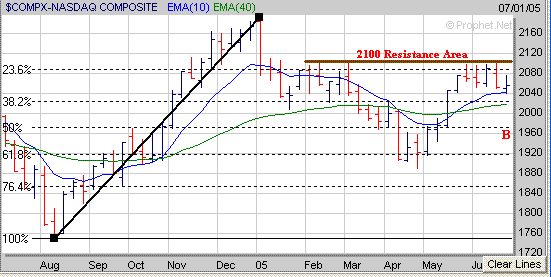
Once again a key sector to keep an
eye on in the weeks ahead is the Semiconductors. The Semiconductor Holders
(SMH) are still exhibiting a potential Double Bottom pattern and have developed
a 4 week Handle (H) while holding support above their 40 Weekly EMA just above
33. In the weeks ahead I see two possibilities for the SMH's. The
first scenario would be for them to break out of their Handle and above the 36
level leading to an eventual move up to the 39 area which is at their 61.8%
Retracement Level (calculated from the January 2004 high to the September 2004
low). If this scenario occurred then this would have a positive affect on
the Nasdaq. On the other hand if the SMH's failed to hold support at their
40 Weekly EMA near 33 while developing their Handle then this would likely lead
to a retest of their April low near 30 which would have a negative affect on the
Nasdaq. 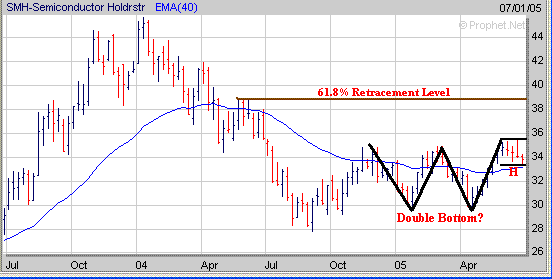
As for the S&P 500 it held
support this week near its 10 Weekly EMA (blue line) around 1190.
However like the Dow its exhibiting a potential bearish looking Head and
Shoulders Top pattern as well. If the S&P 500 can hold support at its
10 Weekly EMA and attempts to rally look for resistance at its 2nd Shoulder near
1120. Meanwhile if the S&P 500 comes under more selling pressure and
drops below 1190 then its next area of support would either be at its 40 Weekly
EMA (green line) near 1170 or at its long term upward sloping trend line (brown
line) originating from its August 2004 low near 1160. 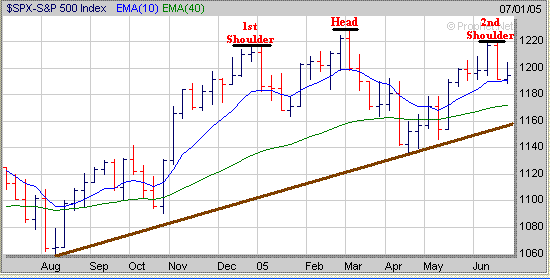
Finally for the first 6 months of
2005 the Oil related stocks have been the best performers as shown by the
table below as 6 out of the top 10 performing sectors are Oil
related.
|
Total |
| Sector |
Return |
|
1/1/05-7/1/05 |
| Oil&Gas-Canadian
Explo/Prod |
44.9% |
| Food-Confectionery |
36.4% |
| Oil&Gas-Drilling |
36.1% |
| Oil&Gas-Canadian
Integrated |
34.7% |
| Consumer-Misc
Products |
34.6% |
| Oil&Gas-Refining/Mktg |
32.9% |
| Oil&Gas-U
S Explo/Prod |
29.7% |
| Retail-Department
Stores |
28.7% |
| Oil&Gas-U
S Integrated |
28.5% |
| Retail-Drug
Stores |
28.2% |
If this trend continues the rest of this year then focus on
those Oil stocks which have developed a favorable chart pattern. Here is
an example of a stock (GMRK) from our watch list which has formed a Double Bottom pattern
and is near the upper end of its 4 week Handle (H). 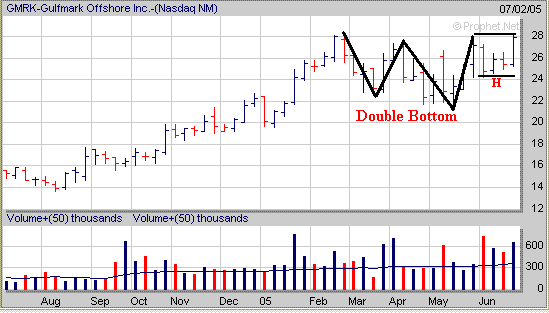
Signup
today for a Premium Membership to Amateur-Investor.net
and have access to our Stocks
to Watch List. In addition you will have access to our ETF
Weekly Buy and Sell Signals, Market
Timing Indicator (MTI) as well.
Click
Here to save up to 50% on a Premium Membership
or to signup for a "Free" 2 Week Trial Membership
Amateur-Investor.net
|


