|
Click
Here to save 50% on Premium Membership to amateur-investor.net
and have access to our Stocks to Watch List and Daily Breakout Reports
(Due to inquiries from investors we have extended our 50% Off Special for
new Members for another week)
Weekend Stock Market Analysis
(7/9/05)
Before the market opened on Thursday the Dow Futures at one time
were down over 200 points, Nasdaq Futures -35 points and S&P 500 Futures -15
points due to the terrorist attack in London. At that point it looked like
the market was in big trouble however none of the major averages dropped nearly
as much at the open as the Futures suggested they would and after the initial
gap down they then rallied strongly the rest of the day into Friday. The
Nasdaq which held support near its 10 Weekly EMA (blue line) the past two weeks
broke above a key resistance level on Friday near 2100. If the Nasdaq
follows through to the upside then its next significant area of upside
resistance would be at its early January high near 2190. 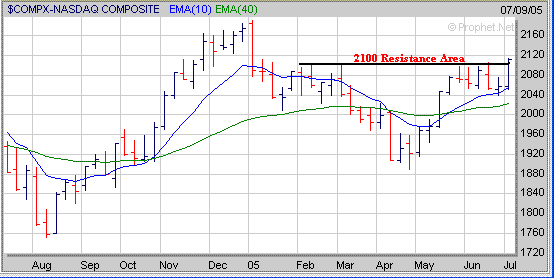
As I have mentioned over the past
few weeks the Semiconductors are a key sector to watch that will have an impact
on the Nasdaq. The Semiconductor Holders (SMH) are near the top of their 5
week Handle (H) after previously forming a potential Double Bottom
pattern. If the SMH's can break out of their Handle then I would expect
them to rise up to either their 50% or 61.8% Retracement Levels which were
calculated from their January 2004 high to their September 2004 low. The
SMH's 50% Retracement Level is near 37 while their 61.8% Retracement Level is
around 39. If the SMH's do eventually rise up to the 37 to 39 range this
should help the Nasdaq rally back to the 2190 level mentioned above. 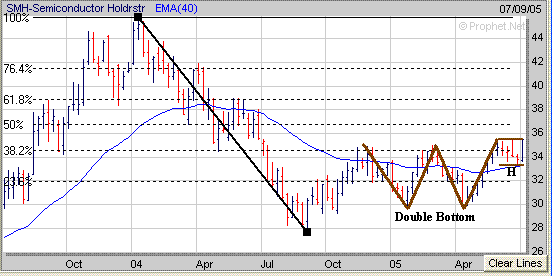
As far as the Dow it found support
last week at its upward sloping trend line (brown line) originating from the
October 2004 low just below 10200 and then rallied strongly on Friday. If
the Dow continues to rally I would look for significant upside resistance to
occur in the 10650 to 10700 range which corresponds to its mid June high and
longer term 23.6% Retracement Level (calculated from the October 2004 low to the
early March high). 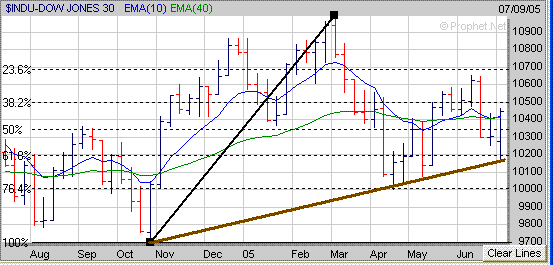 One
thing the Dow and the market in general will still have to deal with in the
future is the price of Crude Oil. The price of Crude Oil has been in an up
trend since the middle part of 2003 and has had an affect on the Dow.
Since the middle part of 2004 when the price of Crude Oil rise above $30 the Dow
has really gone nowhere and has been in a very choppy trading range with its
high near 11000 and the low around 9700. Also as I have stated before the
price of Crude Oil and the Dow have pretty much traded in opposite directions of
each other. When the price of Crude Oil has rallied (points A to B) the
Dow has dropped (points C to D) and when the price of Crude Oil has dropped
(points B to A) the Dow has rallied (points D to C). Thus
if this pattern continues to persist future movements in the Dow may hinge on
what the price of Crude Oil does over the next several weeks. If the price of
Crude Oil continues higher and makes a an eventual run up to $70 or above in the longer term
this would likely have a negative affect on the Dow. However if the price
of Crude Oil were to top out in the lower $60's and then sell off this could
have a positive affect on the Dow in the weeks ahead. 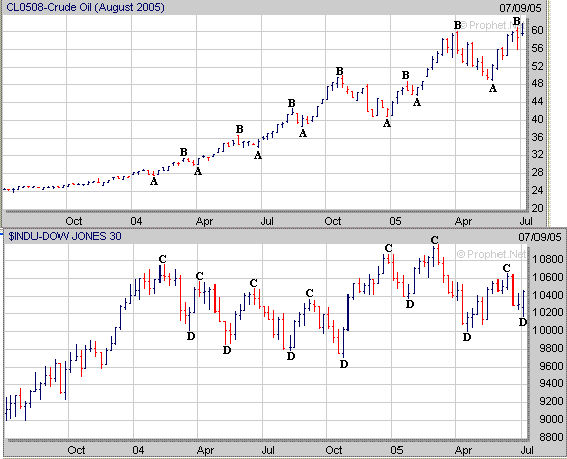
The S&P 500 is still exhibiting
a potential Head and Shoulders Top pattern however if can rise above its
2nd Shoulder near 1220 then this would negate the potential bearish looking
pattern. Thus it will be interesting to see what happens near the 1220
level. If the S&P 500 were able to break above its 2nd Shoulder then
it would likely rally up to its early March high near 1230. 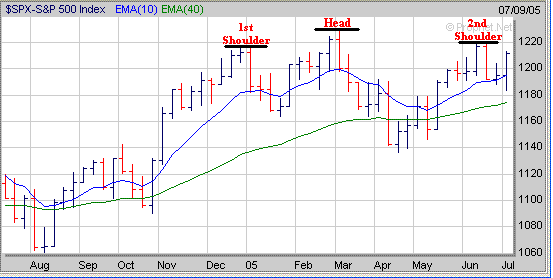
With earnings season picking up over
the next few weeks and the threat of more terrorist activity things could be
rather volatile in the market either to the upside or downside. If
the market is able to follow through from its strong up day on Friday focus on
those stocks that have developed a favorable chart pattern. During the
past year DNA has formed a couple of 4 Week Flat Bases (FB) before moving higher and is
currently developing a 6 week Flat Base. 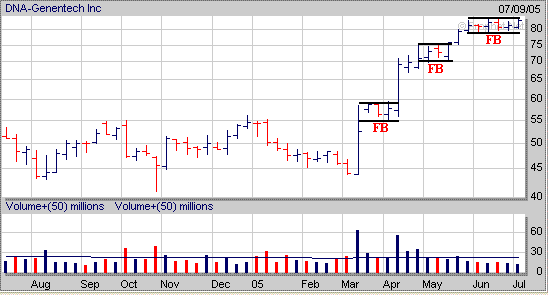
Signup
today for a Premium Membership to Amateur-Investor.net
and have access to our Stocks
to Watch List. In addition you will also have access to our ETF
Weekly Buy and Sell Signals, Market
Timing Indicator (MTI) as well.
Click
Here to save up to 50% on a Premium Membership
or to signup for a "Free" 2 Week Trial Membership
Amateur-Investor.net
|


