|
Click
Here to signup for a "Free" 2 Week Premium Membership
to amateur-investor.net and have access to our
Stocks to Watch List and Daily Breakout Reports
Weekend Stock Market Analysis
(7/16/05)
The major averages followed through this week after have a
strong reversal the previous week after the London terrorist attack. The
price of Crude Oil has pulled back some which might be helping the market as it has
dropped back to its 10 Weekly EMA (blue line) near 57. I see two potential
outcomes for the price of Crude Oil which may have an affect on the major
averages in the weeks ahead. If the price of Crude Oil fails to hold
support at its 10 Weekly EMA near 57 then it may eventually drop back to its
rising 40 Weekly EMA (green line) which is currently near 51. If this
scenario were to occur then this would likely have a positive affect on the
major averages. Meanwhile if the price of Crude Oil holds support
near 57 and then begins to rally again and breaks above the lower 60's I would
expect it to rise up to around the 70 level. If this scenario were to
occur then that probably would have a negative affect on the major
averages. 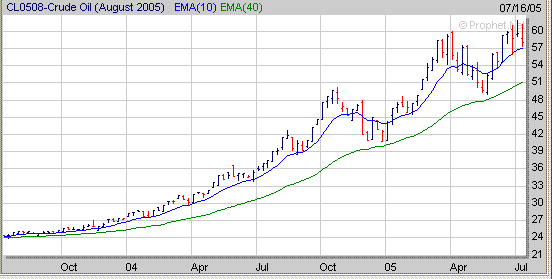 As
far as the major averages the Nasdaq has broken well above its previous
resistance area near 2100. If it continues higher its next area of upside
resistance would be at its early January high near 2190 (point A). 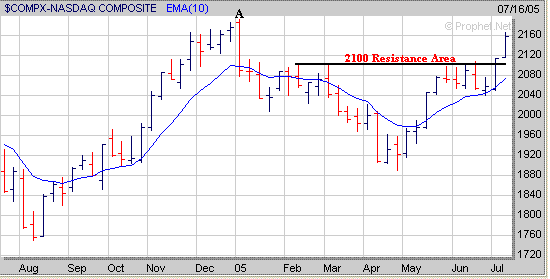
As I have mentioned over the past
month the two sectors that would have an affect on the Nasdaq were the Biotechs
and the Semiconductors. The Biotech Index (BTK) broke out of a longer term
Symmetrical Triangle pattern (solid brown lines) the previous week and continued to
follow through this week. The BTK now has risen above its long term 61.8%
Retracement Level near 600 (calculated from the 2000 high to the 2002
low). The question now is will the BTK be able to rally up to its longer term 76.4%
Retracement Level near 680 (point B)? 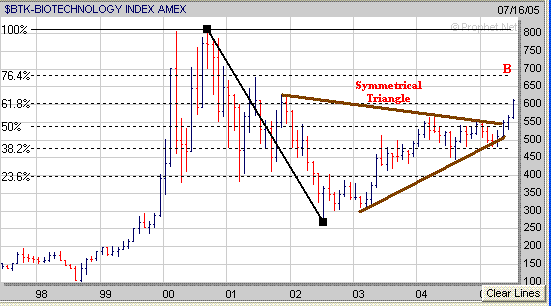
Meanwhile the Semiconductor Holders
(SMH) have now broken out of their 5 week Handle (H) after forming a Double
Bottom pattern and have risen just above their 50% Retracement Level (calculated
from the early January 2004 high to the September 2002 low). If the SMH's
can continue to rally their next significant area of upside resistance would be
at their 61.8% Retracement Level near 39 (point C). Thus if the Biotechs
and the Semiconductors can remain strong this should have a positive affect on
the Nasdaq and eventually allow it to reach the 2190 area as talked about above. 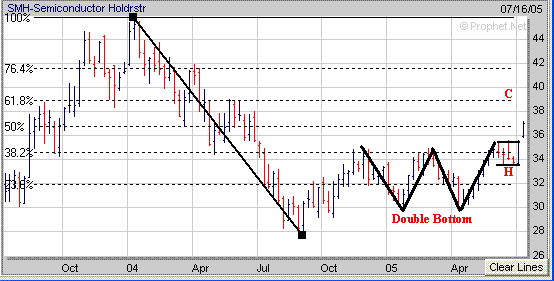
The Dow which found support the
previous week at its upward sloping trend line (brown line) from the October
2004 low has rallied back to where it stalled out in mid May near 10660.
The question at this point is will the Dow be able to break above its 23.6%
Retracement Level just below 10700 (calculated from the October 2004 low to the
early March high) or will it stall out near this level? If the Dow can
rally above the 10700 area then its next area of significant upside resistance
would be in the 10850 to 11000 range. The 10850 area corresponds to the
level it stalled out at in late 2004 (point D) while the 11000 area was the high
made in early March. 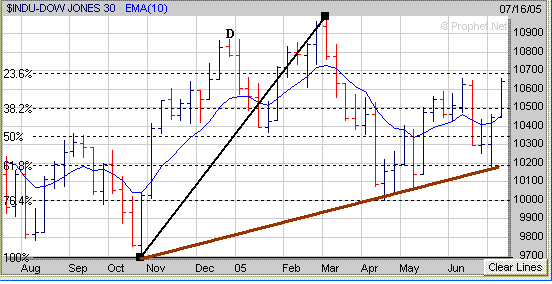
As for the S&P 500 it broke
above its 2nd Shoulder this week which has negated the possible Head and
Shoulders Top pattern and has rallied back to its previous high made in early
March. 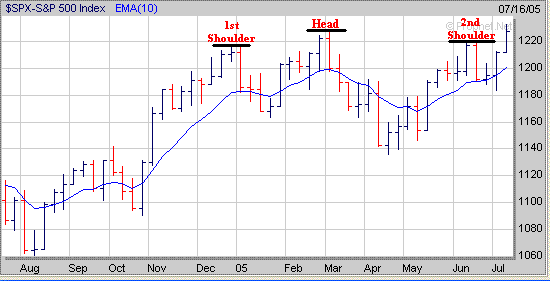
The question for the S&P 500 is
will it now stall out near its early March high or will it continue to move
higher? If the S&P 500 does continue higher its next major upside
resistance area is around 1255 (point E) which corresponds to its longer term
61.8% Retracement Level (calculated from the 2000 high to the 2002 low). 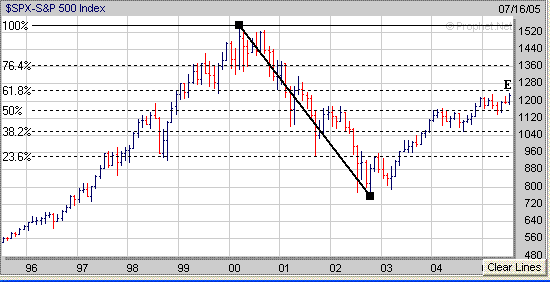
Finally in last Weekend's
Analysis I told everyone to watch DNA in the Biotech sector for a possible
move higher as it had developing another Flat Base (FB). This week DNA
broke strongly out of its 6 week Flat Base. Hopefully some of you were
able to take advantage of this breakout. 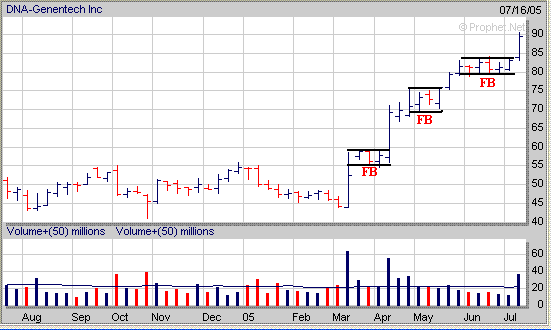
Signup
today for a Premium Membership to Amateur-Investor.net
and have access to our Stocks
to Watch List which included DNA as mentioned above. In addition you will also have access to our ETF
Weekly Buy and Sell Signals, Market
Timing Indicator (MTI) as well.
Click
Here to signup for a "Free" 2 Week Trial Membership
Amateur-Investor.net
|


